El precio de ChainLink (LINK) ha ido aumentando gradualmente en los últimos dos meses. Si bien el movimiento ascendente ha mostrado una fuerza considerable, el precio se está acercando a una zona de resistencia crucial, que podría ser un obstáculo para la tendencia alcista en curso.
Movimiento actual
El precio del LINK se ha estado negociando dentro de un triángulo simétrico a largo plazo desde que alcanzó un máximo histórico de 56.734 satoshis el 3 de marzo. Tanto la línea de soporte como la de resistencia han sido validadas tres veces. En el momento de escribir este artículo, el precio se negociaba cerca de 45.000 satoshis, el nivel de 0,618 Fibras de la disminución más reciente. Aunque esta zona rechazó el precio el 4 de junio, se está preparando para hacer otro intento. Si tiene éxito en la ruptura, la línea de resistencia del triángulo se puede encontrar en 49.500 satoshis. El RSI diario está por encima de 50 y no está formando ninguna divergencia bajista, una señal de que el precio probablemente siga subiendo.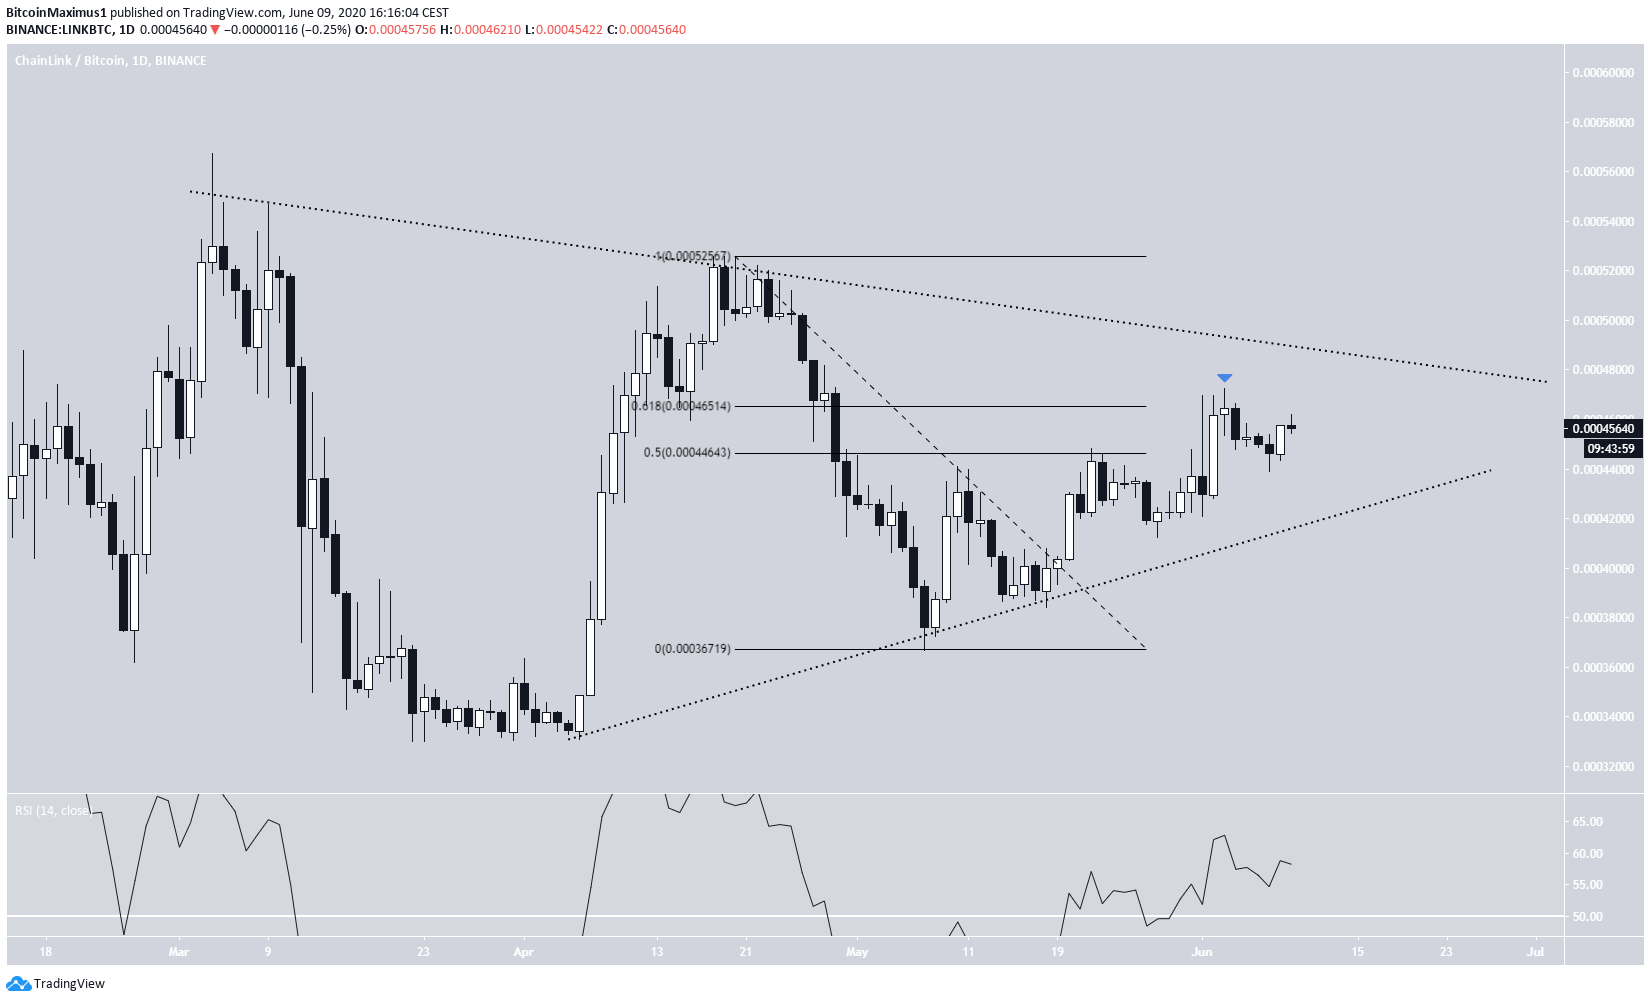
$LINK looks like it wants to go on a run again. Do it, and never return.
LINK/USD
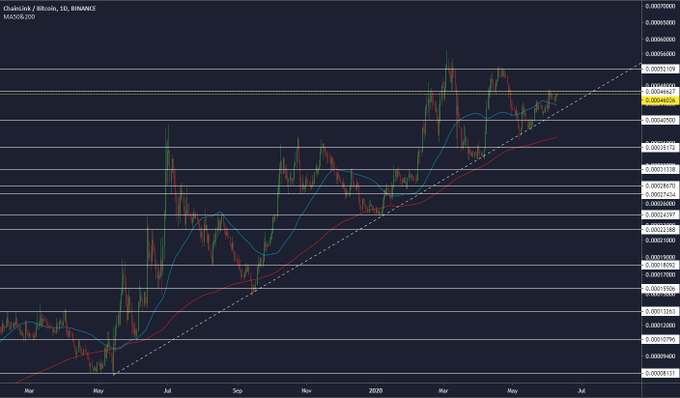
The LINK/USD pair has been trading inside a rising channel since March 13. It showed strength by breaking out above the $4.1 area and then using that as support, creating a long upper wick in the process. The price is expected to reach the $4.9 area, which is close to the all-time high price. A successful break out could move it towards the resistance line of the channel, which currently sits at $5.4. At the time of writing, we cannot confidently predict whether it will break out or not. The mindful trader will have to pay attention to price movements and possible divergence when the time comes.
Trusted
Descargo de responsabilidad
Descargo de responsabilidad: en cumplimiento de las pautas de Trust Project, BeInCrypto se compromete a brindar informes imparciales y transparentes. Este artículo de noticias tiene como objetivo proporcionar información precisa y oportuna. Sin embargo, se recomienda a los lectores que verifiquen los hechos de forma independiente y consulten con un profesional antes de tomar cualquier decisión basada en este contenido.

Daniel Ramirez-Escudero
Periodista y editor de noticias, gestor de la sección de opinión. Ex-editor jefe de BeInCrypto ES. Adicto a cripto desde el 2017 y gran admirador del proyecto de Satoshi Nakamoto. Amante del mundo, desde la infancia he vivido en Londres, Bruselas, Santiago de Chile, Amsterdam y Barcelona actualmente alternando entre Madrid y Palma de Mallorca. Licenciado en Comunicación Audiovisual y con un Master de Web Design and Development. Ama escribir, analizar y debatir sobre el ecosistema cripto.
Periodista y editor de noticias, gestor de la sección de opinión. Ex-editor jefe de BeInCrypto ES. Adicto a cripto desde el 2017 y gran admirador del proyecto de Satoshi Nakamoto. Amante del mundo, desde la infancia he vivido en Londres, Bruselas, Santiago de Chile, Amsterdam y Barcelona actualmente alternando entre Madrid y Palma de Mallorca. Licenciado en Comunicación Audiovisual y con un Master de Web Design and Development. Ama escribir, analizar y debatir sobre el ecosistema cripto.
READ FULL BIO
Patrocinado
Patrocinado